Article
9
min
Article
How to Calculate ROI on Capital Improvements
Learn how to calculate return on investment for capital improvements in commercial real estate. Formulas, methods, and frameworks for evaluating renovation projects.
January 2026

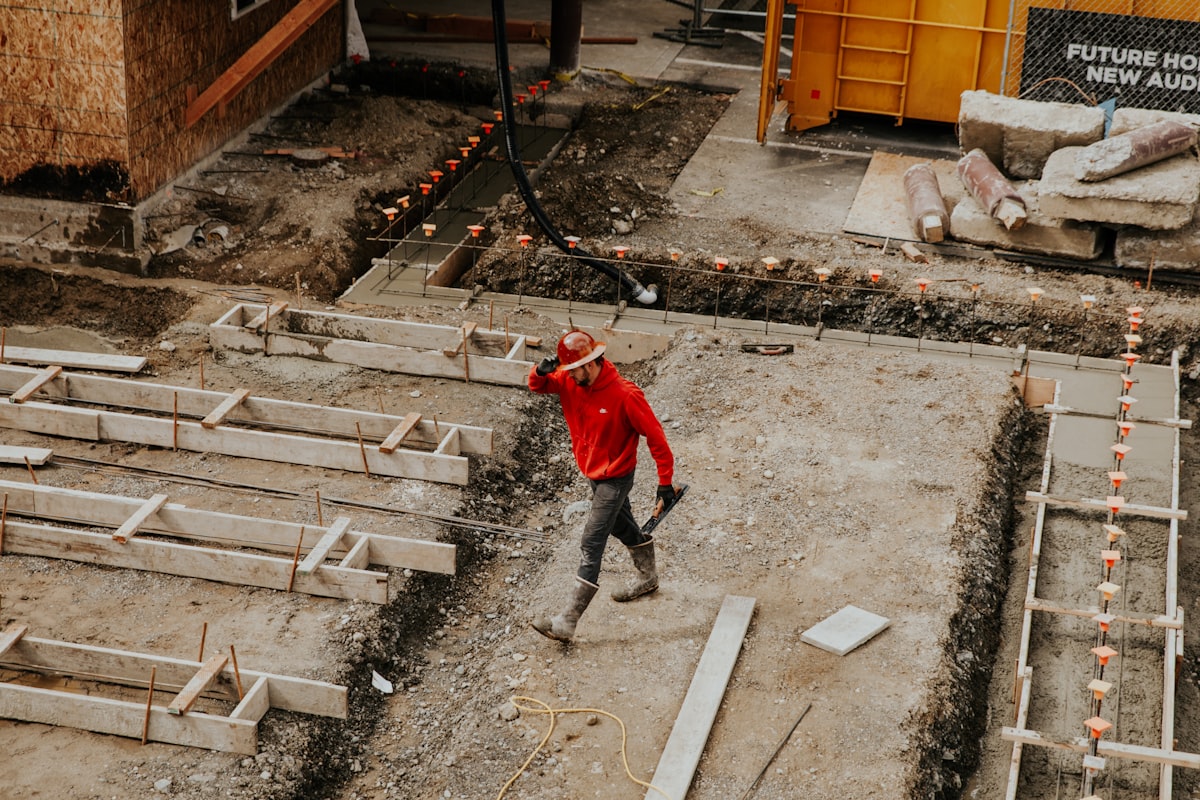
Return on investment (ROI) for capital improvements measures the financial return generated by property upgrades relative to their cost. ROI calculation helps operators compare competing projects, justify capital requests, and evaluate whether completed improvements delivered expected value. For commercial real estate, ROI on capital improvements typically considers increased rental income, reduced operating costs, or enhanced property value.
Capital budgets are finite. Every portfolio has more potential improvements than available funding. Without a consistent method for evaluating returns, capital allocation becomes political rather than analytical. Projects get funded based on who advocates loudest, not which investments deliver the best returns.
The challenge extends beyond project selection. Operators need to justify capital requests to investors and lenders. "We need a new roof" is a maintenance argument. "This roof replacement will prevent $50,000 in annual leak damage and preserve $2M in asset value" is a financial argument. ROI analysis provides the framework for making financial cases.
Post-completion, ROI analysis enables accountability. Did the lobby renovation actually improve tenant retention? Did the energy retrofit deliver projected savings? Without measuring actual returns against projections, operators can't improve their estimation accuracy or learn which improvement types deliver in their portfolio.
ROI calculation varies widely across the industry. Common approaches include:

Effective ROI analysis requires clear definitions, consistent methodology, and appropriate metrics for different improvement types.
Capital improvements generate returns through different mechanisms. Identify which applies to your project:
Revenue Enhancement
Cost Reduction
Value Preservation
Asset Appreciation
Calculate total project cost, including all components:
| Cost Component | Description |
|---|---|
| Hard costs | Construction, materials, equipment |
| Soft costs | Design, permits, inspections, project management |
| Contingency | Budget reserve for unknowns (typically 10-20%) |
| Financing costs | Interest during construction if applicable |
| Vacancy loss | Revenue lost if units are offline during work |
| Tenant incentives | Concessions required due to disruption |
Estimate financial benefits over the improvement's useful life:
For revenue improvements:
For cost reductions:
For value preservation:
Use multiple metrics to evaluate returns comprehensively:
Simple ROI
ROI = (Total Benefits - Total Cost) / Total Cost × 100
Best for: Quick comparison of similar projects over similar timeframes.
Payback Period
Payback = Total Cost / Annual Benefit
Best for: Understanding how quickly investment is recovered. Useful for cash flow planning.
Net Present Value (NPV)
NPV = Σ (Cash Flow / (1 + r)^t) - Initial Investment
Best for: Comparing projects with different timelines and cash flow patterns. Accounts for time value of money.
Internal Rate of Return (IRR) The discount rate at which NPV equals zero. Best for: Comparing returns to cost of capital or alternative investments.
Cash-on-Cash Return
Cash-on-Cash = Annual Cash Flow / Total Cash Invested × 100
Best for: Evaluating returns relative to actual cash deployed, especially relevant for leveraged investments.
Establish minimum return thresholds based on project type and risk:
| Project Type | Typical Hurdle | Rationale |
|---|---|---|
| Life safety/compliance | No minimum | Required regardless of return |
| Asset preservation | 0-5% | Prevents larger future costs |
| Cost reduction | 15-20% | Should exceed cost of capital |
| Revenue enhancement | 20-30% | Higher risk requires higher return |
| Speculative repositioning | 30%+ | Significant execution risk |
| Metric | Definition | Target Range |
|---|---|---|
| Projected vs. actual ROI | Comparison of estimated and realized returns | Within 20% indicates good estimation |
| Payback period accuracy | Projected vs. actual time to recover investment | Within 6 months for 3-year projects |
| Rent premium achieved | Actual rent increase vs. projected for renovations | 90%+ of projection |
| Energy savings realized | Actual utility reduction vs. projected | 80%+ of projection |
Ignoring vacancy loss: A unit renovation takes 3 weeks. That's $1,500-$3,000 in lost rent that should be included in project cost. Operators often calculate ROI on hard costs only.
Overstating rent premiums: Projecting $200/month rent increase when the market supports $100. Validate assumptions against actual lease comps, not aspirational pricing.
Using inconsistent timeframes: Comparing a 5-year NPV for one project against a 10-year NPV for another. Standardize projection periods for meaningful comparison.
Ignoring maintenance cost changes: New HVAC system has lower maintenance than the old one. Energy savings projections often miss the maintenance benefit.
Not tracking actual returns: Projects are approved based on projected ROI, but no one measures actual performance. Without feedback loops, estimation doesn't improve.
Sophisticated operators embed ROI analysis into their capital planning process, not as an afterthought but as a core decision-making tool.
What is a good ROI for capital improvements in real estate?
Target ROI varies by improvement type and risk level. Cost reduction projects should exceed your cost of capital, typically 15-20%. Revenue enhancement projects carry more risk and should target 20-30% or higher. Asset preservation work may have lower direct ROI but prevents larger losses. Life safety and compliance projects are required regardless of return.
How do you calculate ROI on a rental property renovation?
For rental renovations, calculate the total project cost including vacancy loss, then estimate the annual rent increase the renovation will support. Divide annual additional rent by total cost for simple ROI. For example, a $15,000 unit renovation that increases rent by $200/month ($2,400/year) delivers 16% annual ROI. Factor in your expected hold period and use NPV for more precise analysis.
Should you use NPV or IRR for capital improvement decisions?
Use both. NPV tells you the total dollar value created by the investment and works well for comparing projects of different sizes. IRR tells you the percentage return and helps compare against your cost of capital or alternative investments. Neither metric alone tells the complete story. Also consider payback period for cash flow planning.
How do you account for risk in ROI calculations?
Apply higher hurdle rates to riskier projects—speculative improvements should require higher returns than proven improvement types. Use sensitivity analysis to model scenarios where key assumptions (rent increase, cost savings, timeline) fall short of projections. Weight your projections toward conservative assumptions rather than best-case outcomes.
ROI Calculation Checklist:
Key Takeaways:
.png)